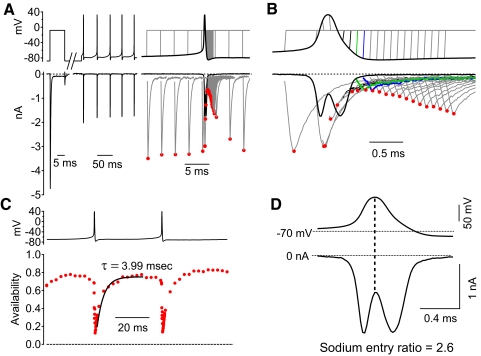
Fig. 5.
Measurement of sodium channel availability during action potential firing. A: each voltage command waveform started with a test step to −8 mV from a holding potential of −88 mV to measure full sodium channel availability, followed by about 150 ms of spontaneous action potential firing that was recorded in the same neuron and finally a voltage step to −8 mV to measure availability, added at different times during and after the last action potential in each of 80 different waveforms. The sodium current elicited by the waveforms is shown below. Currents were reduced to controllable values using subsaturating (30 nM) TTX and currents blocked by subsequent addition of 1 μM TTX were subtracted. Peak current during each step is marked by a red circle. B: sodium currents evoked by a subset of the waveforms shown on a finer timescale. Green traces show the voltage protocol and elicited current corresponding to the minimum availability, achieved shortly before the trough of the action potential. Blue traces correspond to measurements 100 μs later, when recovery from inactivation is just beginning. C: sodium channel availability was measured as peak current evoked by the second pulse to −8 mV, normalized to the current evoked by the first pulse to −8 mV from a holding potential of −88 mV, where essentially all channels are available (Fig. 11A). Availability is plotted as a function of the time during the firing cycle that the second pulse was delivered. Sodium channel availability immediately after the action potential reached a minimum of 13%. The time course of recovery of availability during the interspike interval (ISI) could be fit well by a single exponential with a time constant of 3.99 ms (black trace), with sodium channel availability reaching a maximum of 78% in between spikes. D: sodium current during the action potential waveform showed incomplete inactivation and a large amount of sodium current during the downstroke of the action potential (a sodium entry ratio of 2.59).

