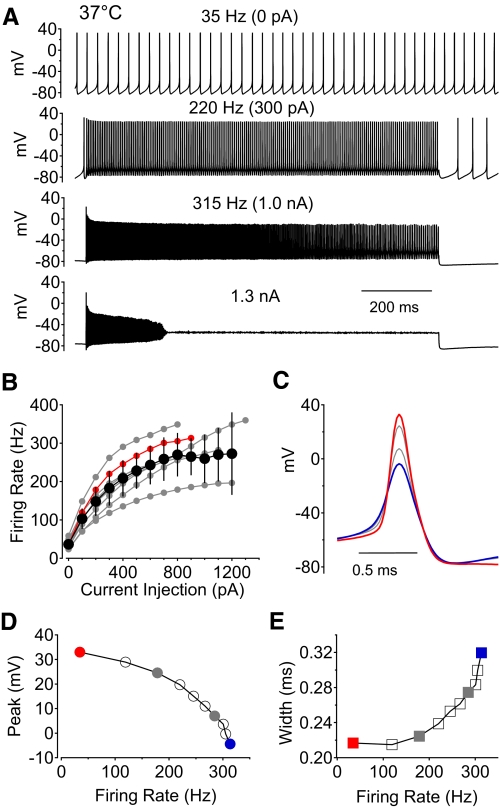
Fig. 8.
Current-clamp recordings of spontaneous and stimulated firing in response to current injection at 37°C. A: voltage recordings of spontaneous action potential firing (top) and firing evoked by 1 s long current injections of increasing magnitude until the neuron ceased firing during the stimulating pulse (in this case during an injection of 1.3 nA). B: summary of results from 8 neurons plotting the firing frequency vs. current injection. Black symbols represent average ± SD; the red symbols are from the example neuron shown in A, C, D, and E. Only pulses in which firing was sustained throughout the full 1-s current injection were included in the average. C: averaged action potentials from the cell in A for each level of current injection, illustrating the change in action potential shape with firing frequency. Red trace: spontaneous action potential. Blue trace: action potential of the most rapid firing before failure. D: action potential peak voltage as a function of firing frequency. E: action potential width (measured at half the maximal amplitude) as a function of firing frequency.

