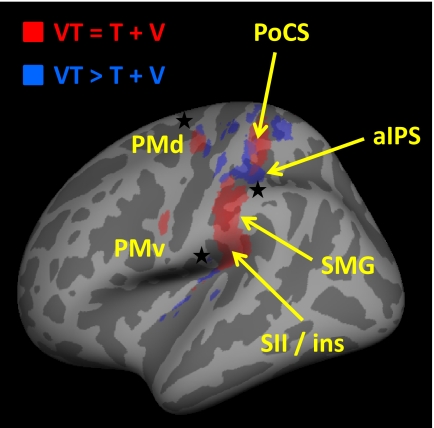
Fig. 2.
Illustration of the superadditive and additive responses. Activation maps corresponding to additive (red) and superadditive (blue) responses to multisensory stimulation, displayed on an inflated average cortical surface of the left hemisphere. For display purposes only, the statistical thresholds were chosen to be P < 0.005 for both contrasts. A black star in the vicinity of a blue color-coded cluster indicates superadditive responses that are significant after correction for multiple comparisons (P < 0.05 corrected); these are located in the insular region, premotor cortex and anterior intraparietal cortex. All red color-coded clusters contained statistically significant (P < 0.05 corrected) local maxima, reported in Table 1. PMv, ventral premotor cortex; PMd, dorsal premotor cortex; PoCS, postcentral sulcus; aIPS, anterior intraparietal sulcus; SMG, supramarginal gyrus; SII/ins, secondary somatosensory cortex / insular region. The data corresponding to this figure are reported in Table 1.

