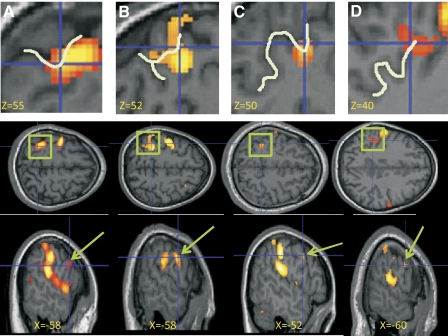
Fig. 6.
Consistent activations across individual participants. Convergence of unisensory tactile and visual responses in 4 individual participants, labeled A–D. Middle: active clusters in the cortex within and around the intraparietal sulcus outlined by green squares. Top: an enlarged view of the area within each square; for ease of anatomical localization, a segment of the intraparietal sulcus is outlined. Bottom: active clusters in the ventral premotor cortex (inferior part of the precentral gyrus and sulcus), highlighted by green arrows. All activation maps were thresholded at P < 0.001, uncorrected for display purposes only.

