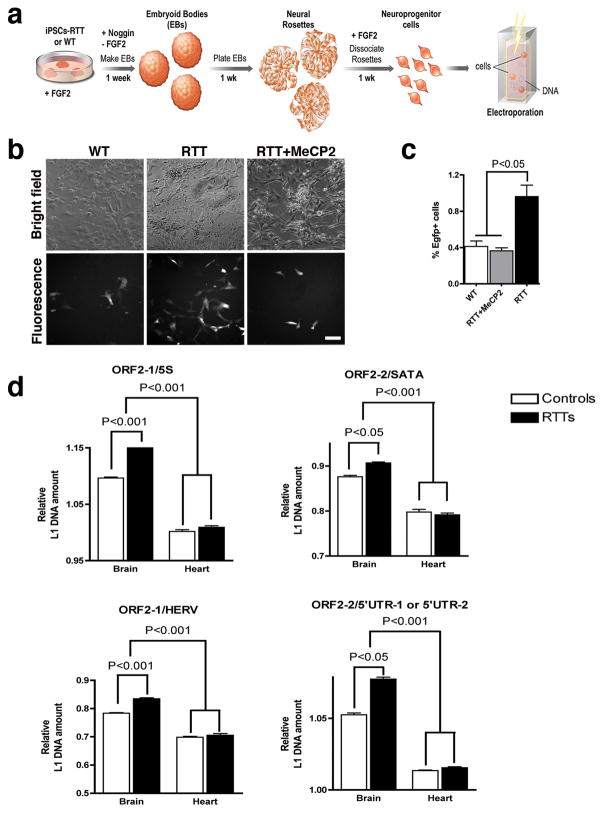
Fig. 4.
L1 retrotransposition in RTT patients. a, Schematic view of the NPC differentiation from iPSC followed by L1RE3-EGFP electroporation. b, Representative images of iPSC-derived NPC expressing EGFP after L1 retrotransposition. Bar=30 μm. c, Quantification of the EGFP-positive cells after transfection. d, Primers for ORF2 were used to multiplex with primers for control sequences, such as the 5S ribosomal gene (5S), the satellite alpha (SATA) region, the human endogenous retrovirus H (HERV) sequence and the 5’UTR. The inverse ratio of ORF2/5S represents the amount of L1 ORF2 sequence in each sample (n=5 individuals/group). Similar results were obtained when different primers/probe for ORF2 (ORF2-2) were multiplex/normalized to other control sequences, using two pair of primers (5’UTR-1 or 5’UTR-2). Error bars show s.e.m, and the experiments were performed in triplicate.

