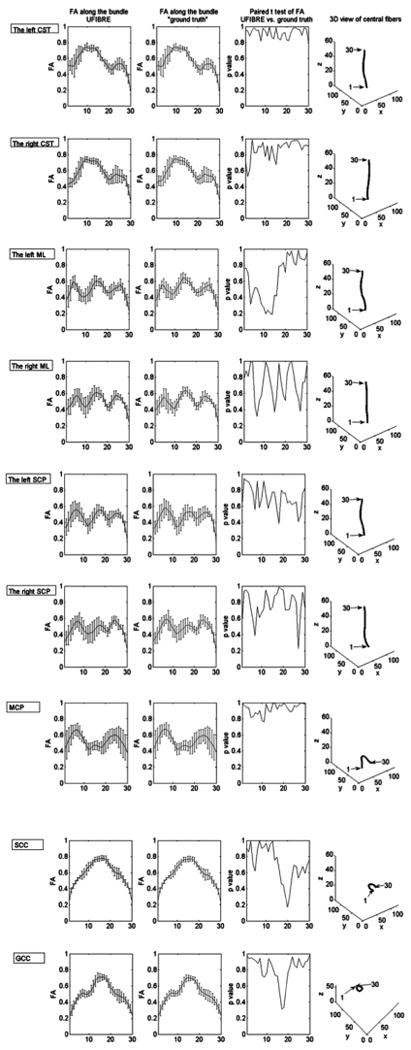
Fig. 5.

Comparisons between F and F̄ along bundles. The curve in the first column shows the group mean F with its standard deviation as error bars. Similarly the second column shows the group mean and standard deviation of F̄. The p-values of paired t-tests of F and F̄ are plotted in the third column. The last column shows the locations of the proximal and distal ends of each of the fiber bundles studied.
