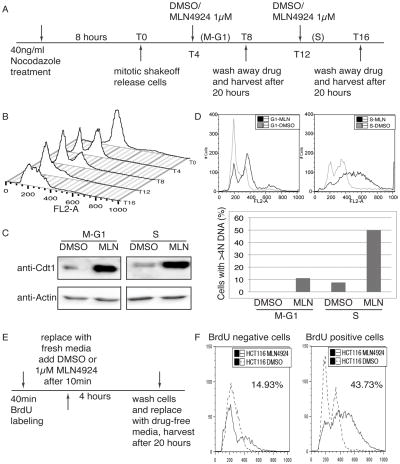
Figure 4. S phase cells are more susceptible to MLN4924 induced re-replication.
(A) Schematic of experimental procedures of (B) to (D). (B) FACS profiles of control samples harvested at indicated time points. (C) Total lysates from cells harvested 20 hours after the drug wash-out were blotted with indicated antibodies. (D) FACS profiles from above cells were shown. The percentage of cells with >4N DNA is plotted in the bar graphs below. (E) Schematic of experiment of (F). (F) FACS profiles were shown as indicated. (Dashed line: DMSO; solid line: MLN4924) Percentages of re-replicating cells after MLN4924 treatment are indicated.

