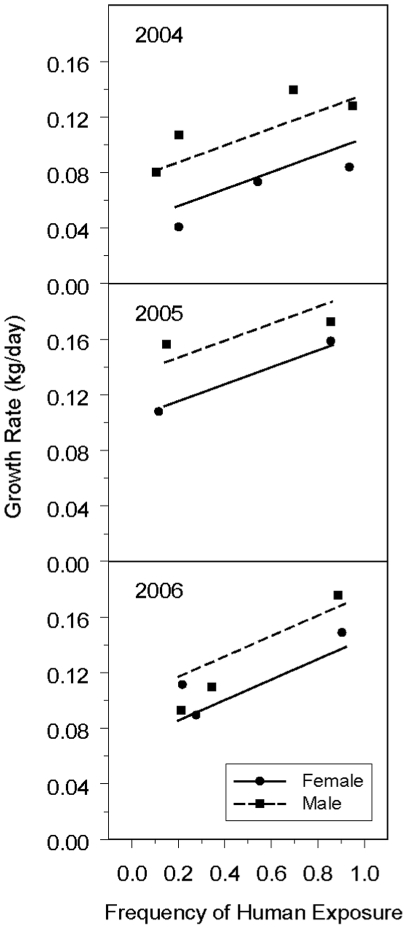
Figure 3. California sea lion pup growth rates versus frequency of human exposure.
Growth rate and human exposure frequency for males (M) and females (F) in 3 years. Symbols depict observed data; the curve depicts the regression of growth rate (kg/day) on frequency of human exposure (days with observed human presence/number of observation days in scanning period).

