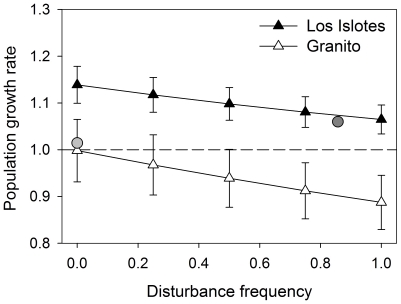
Figure 4. Predicted changes in annual population growth rates (λ) due to varying frequencies of human exposure.
Triangles represent estimated λs for mean survival and growth rates. Error bars are λ's estimated for the upper and lower 95% confidence interval values of the survival and growth rates. Grey circles indicate values of λ predicted for the observed reproductive rate and the observed frequency of human exposure in July 2006 (light grey: Granito; dark grey: Los Islotes). The dashed horizontal line separates the region of increasing populations (λ>1) from that of decreasing populations (λ<1).

