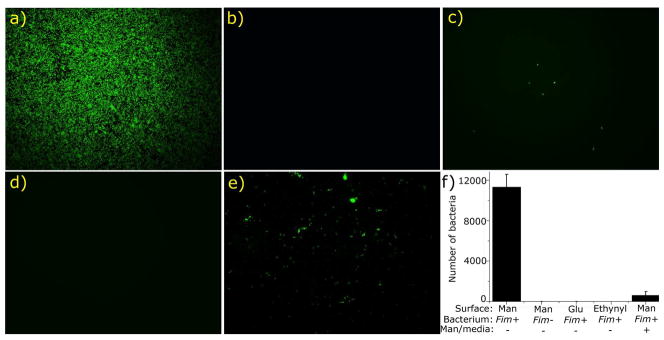
Figure 5.
Fluorescent images (a–e) of various modified surfaces incubated with fim+ and fim− E. coli, and a plot (f) of the numbers of E. coli in all images with a standard deviation on these surfaces. The combinations depicted are: the mannose-presenting film E and fim+ E. coli (a, bacterial count: 11313 ± 1241 for f), film E and fim− E. coli (b, bacterial count: 1 ± 1 for f), the glucose-presenting films F and fim+ E. coli (c, bacterial count: 7 ± 1 for f), the ethynyl-presenting films B and fim+ E. coli (d, bacterial count: 0 ± 0 for f), and film E and the fim+ E. coli that had been pre-saturated with mannose in the media (e, bacterial count: 627 ± 352 for f). Each image is representative of up to 20 images obtained on random locations at the sample surface (for examples, see Figures S2–S6 in Supporting Information).

