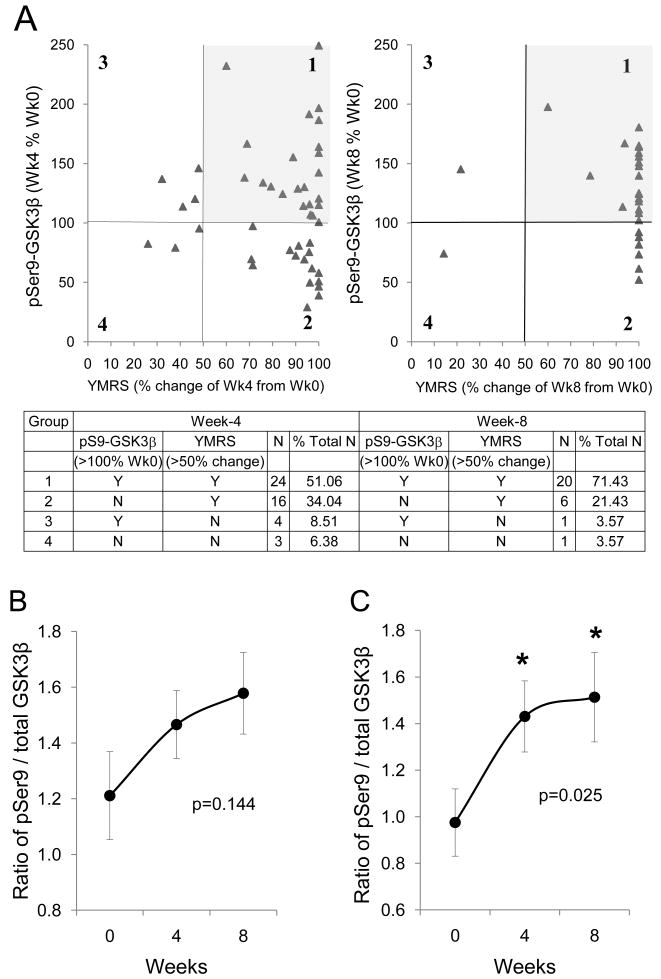
Fig. 2.
Change of phospho-Ser9-GSK3β before and after antimanic treatment of bipolar manic subjects. (A) Phospho-Ser9-GSK3β was plotted against Young Mania Rating Scale (YMRS) score of each individual subject. Data were grouped as (i) clinical responders (defined as > 50% change from Week 0 YMRS score) with an increase in phospho-Ser9-GSK3β; (ii) clinical responders without an increase in phospho-Ser9-GSK3β; (iii) poor clinical responders (defined as < 50% change from Week 0 YMRS score) with an increase in phospho-Ser9-GSK3 β; and (iv) poor clinical responders without an increase in phospho-Ser9-GSK3 β. (B) The ratio of phospho-Ser9-GSK3β to total GSK3β from peripheral blood mononuclear cells (PBMCs) of 47 bipolar manic subjects who received any combination of antimanic treatment (see Table 2). (C) The ratio of phospho-Ser9-GSK3β to total GSK3β from PBMCs of 20 bipolar manic subjects who received lithium + olanzapine treatment. Mean ± SEM, *p < 0.05 in ANOVA post-hoc analysis comparing Week 4 and Week 8 to Week 0. GSK = glycogen synthase kinase-3.

