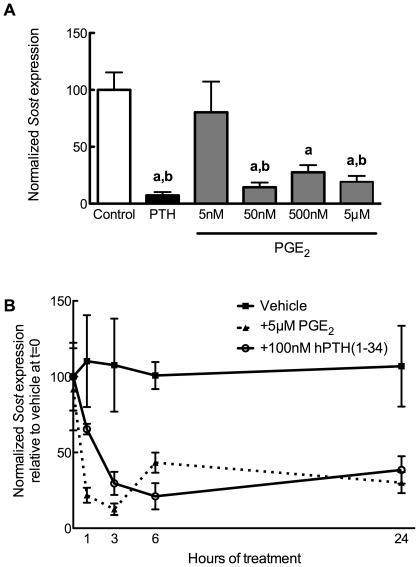
Figure 1. PGE2 decreases Sost expression.
(A) Human PTH(1–34) (100 nM) or PGE2 (5 nM–5 µM) or vehicle control (0.05% DMSO) was added to UMR 106.01 cells for 3 hours. Total RNA was collected and analyzed for Sost and Rpl32 expression by qPCR. n = 6–10 samples per treatment. a indicates p<0.05 versus Control; b indicates P<0.05 versus 5 nM PGE2. (B) Sost mRNA expression was quantified in UMR 106.01 cells after 0, 1, 2, 3, 6, or 24 hours treatment with 5 µM PGE2 or vehicle control. n = 4 samples per treatment. For PGE2, each time point is significantly different (p<0.05) from Control, while for PTH, every time point except 1 hr is significantly different (p<0.05) from Control.

