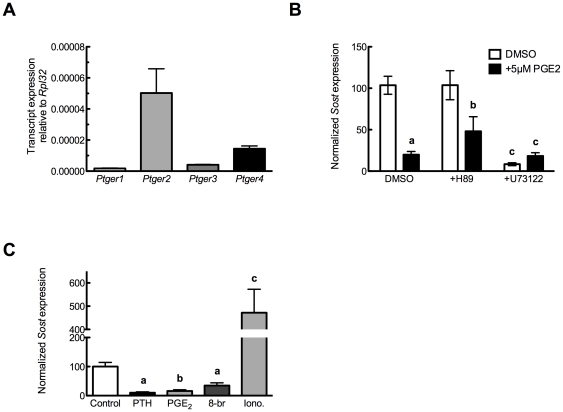
Figure 3. PGE2 receptor expression and influence of PGE2 selective agonists upon Sost expression.
(A) UMR106.01 cells analyzed for Ptger1, Ptger2, Ptger3, and Ptger4 transcript expression by qPCR. Data are normalized to Rpl32. n = 4 samples. (B) UMR106.01 cells were cultured with DMSO as vehicle control, 100 nM hPTH(1–34), 5 µM PGE2 in the presence and absence of inhibitors of protein kinase A (H-89, 2.5 µM) or phospholipase C (U73122, 10 µM), for 3 hours. Total RNA was analyzed for Sost and normalized to Rpl32. n = 4–8 samples. Compared to solvent control, a indicates p<.001 and b indicates p<0.05; c indicates p<.001. (C) UMR106.01 cells were cultured with DMSO as vehicle control, 100 nM hPTH(1–34), the cell-permeant cyclic AMP analogue 8-br-cAMP (1 mM) or the calcium ionophore ionomycin (1.3 µM) for 3 hours, after which total RNA was collected and analyzed for Sost and Rpl32. n = 4–8 samples. Versus Control, a indicates p<0.05, b indicates p<0.01, and c indicates p<0.001.

