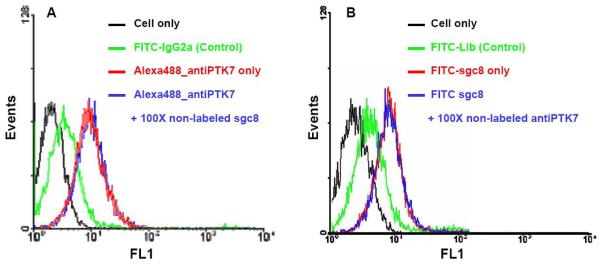
Figure 2.
Competition studies between aptamer sgc8 and antibody anti-PTK7 on receptor PTK7. (A) Flow Cytometry assay to monitor the fluorescence intensities from the Alexa488-labeled anti-PTK7 in the presence and absence of 100X non-labeled sgc8. The red curve indicates the fluorescence intensity from cell membrane with saturated concentrations of Alexa488-labeled anti-PTK7 (200 nM) in the absence of non-labeled sgc8. The blue curve shows the fluorescence shift in the presence of 100× non-labeled sgc8. The black curve marks the fluorescence background with cells only, and the green curve shows the binding of control antibody FITC-labeled isotype Mouse IgG2a. (B) Flow Cytometry assay to monitor the fluorescence intensities from the FITC-labeled sgc8 in the presence and absence of 100X non-labeled anti-PTK7. The red curve indicates the fluorescence intensity from cell membrane with saturated concentrations of FITC-sgc8 (200 nM) in the absence of non-labeled anti-PTK7. The blue curve shows the fluorescence shift in the presence of 100× non-labeled anti-PTK7. The black curve marks the fluorescence background with cells only, and the green curve shows the binding of control antibody FITC-labeled isotype Mouse IgG2a. FL1: fluorescence channel 1 in Flow Cytometer at 520 nm. FITC: fluorescein isothiocyanate.

