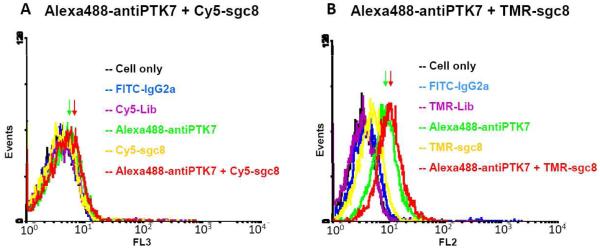
Figure 3.
Measure the distance between two binding sites using FRET. (A) The flow cytometry histogram indicates the Flow Cytometry assay to monitor the fluorescence intensities at channel 3 (collecting emission signal at 650±30 nm) from the cell membrane with an excitation source at 488nm, which is the FRET signal from Alexa488-antiPTK7 to Cy5-sgc8. X-axis “FL3” represents the fluorescence emission intensity collected in Channel 3 (650±30 nm) in the Flow Cytometer. The y-axis “events” represents the number of events (cell count). The higher FRET signal is obtained from the cell surface, a more right-shift of the peak in the histogram will be shown. The green curve indicates the fluorescence intensity from the cell membrane with saturated concentrations of Alexa488-labeled anti-PTK7 (200nM). The yellow curve shows the fluorescence intensity with saturated concentrations of Cy5-labeled sgc8 (200nM). The red curve indicates the fluorescence intensity in the presence of both Alexa488-antiPTK7 (200nM) and Cy5-sgc8 (200nM) on the cell membrane. The black curve marks the fluorescence background with cells only, and the blue curve and purple curve show the binding of FITC-labeled control antibody FITC-labeled isotype Mouse IgG2a and Cy5-labeled unselected DNA library, respectively. (B) The flow cytometry histogram indicates the Flow Cytometry assay to monitor the fluorescence intensities at channel 2 (collecting emission signal at 585±42 nm) from the cell membrane with an excitation source at 488nm, which is the FRET signal from Alexa488-antiPTK7 to TMR-sgc8. The x-axis “FL2” represents the fluorescence emission intensity collected in Channel 2 (585±42 nm) in the Flow Cytometer. The y-axis “events” represents the number of events (cell count). The green curve indicates the fluorescence intensity from the cell membrane with saturated concentrations of Alexa488-labeled anti-PTK7 (200nM). The yellow curve shows the fluorescence intensity with saturated concentrations of TMR-labeled sgc8 (200nM). The red curve indicates the fluorescence intensity in the presence of both Alexa488-antiPTK7 (200nM) and TMR-sgc8 (200nM) on the cell membrane. The black curve represents the background signal from cell only without any dye-labeled ligands in the system. The blue curve and purple curve were the negative controls showing the binding of control antibody FITC-labeled isotype Mouse IgG2a and TMR-labeled unselected DNA library, respectively. Excitation source: Argon laser at 488nm. Channel 1: e collecting emission at 530±30 nm; Channel 2:collecting emission at 585±42 nm; Channel 3: collecting emission at 650±30 nm. Alexa Fluor® 488: maximum absorption: 495nm, maximum emission: 519nm; FITC: fluorescein isothiocyanate, maximum absorption: 494nm, maximum emission: 520nm; TMR: Tetramethylrhodamine, maximum absorption: 546nm, maximum emission: 574nm; Cy5: Cyanine 5, maximum absorption: 650nm, maximum emission: 670nm.

