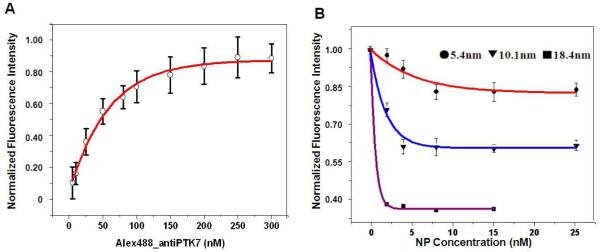
Figure 4.
Ligand binding saturation concentration determinations. (A) KD binding curve for ligand Alexa488-antiPTK7 on CEM cells. The fluorescence intensities were normalized. The fluorescence intensity with cell only (without any labeled ligands) was set as the background “0”, and the maximum fluorescence intensity was set as “1”. B) KD binding curves for 5.4, 10.1 and 18.4 nm gold NP-aptamer conjugates on CEM cells. Red curve: 5.4 nm gold NP-aptamer conjugates; Blue curve: 10.1 nm gold NP-aptamer conjugates; Purple curve: 18.4 nm gold NP-aptamer conjugates. The fluorescence intensities were normalized. The fluorescence intensity with cell only (without any labeled ligands) was set as the background “0”, and the fluorescence intensity with saturated Alexa488-antiPTK7 alone was set as the maximum intensity “1”. Each fluorescence signal has subtracted the background signal (intensity with cell alone).

