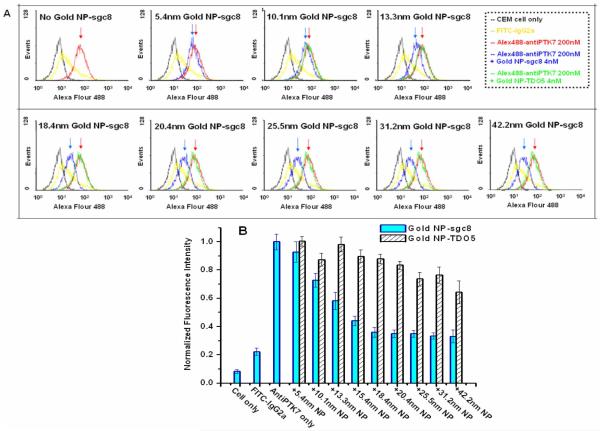
Figure 5.
Flow cytometry assay to monitor the fluorescence intensities on live cells. A) Fluorescence intensity from the Alexa488-labeled anti-PTK7 in the presence of varying sizes of gold NP-aptamer conjugates on live cell membrane was monitored using a Flow cytometer. On each frame, the red curve indicates the fluorescence intensity from cell membrane with saturated concentrations of Alexa488-labeled anti-PTK7 with no gold NP-aptamer conjugate. The red arrow indicates the mean intensity. The blue curve shows the fluorescence shift in the presence of gold NP-sgc8 conjugates. The gap between the blue and red arrow indicates that the fluorescence intensity decreased with the increasing size of the gold NP conjugates. The green curve represents the fluorescence intensity in the presence of the same-sized gold NP, but the NP was conjugated with a control aptamer sequence, TDO5, which does not bind the receptor PTK7. No significant fluorescence shift was shown for the control. The black curve marks the fluorescence background with cells only, and the yellow curve shows the binding of control antibody FITC-labeled isotype Mouse IgG2a. B) Histogram of the mean fluorescence intensity for the fluorescence quenching assay determined from the flow cytometry results. All of the experiments for the fluorescence quenching assay were repeated three times, and the average value was determined as the mean fluorescence intensity.

