
Figure 9.
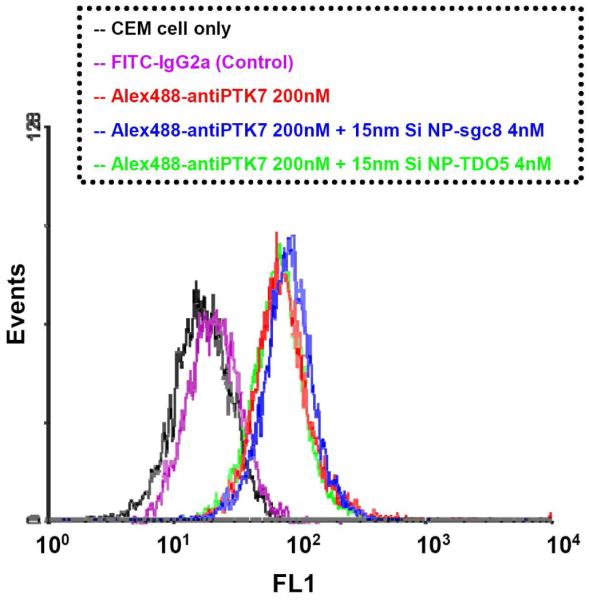
Flow cytometry analysis to monitor the fluorescence quenching effect with 15-nm silica nanoparticles. The red curve indicates the fluorescence intensity from cell membrane with saturated concentrations of Alexa488-labeled anti-PTK7 in the absence of the SiNP-aptamer conjugates. The blue curve shows the fluorescence shifts in the presence of the 15-nm SiNP-sgc8 conjugates, and the green curve represents the fluorescence intensity in the presence of the 15-nm SiNP-TDO5 conjugates, the control aptamer sequence. No significant fluorescence shiftback was observed in the presence of either SiNP-sgc8 or SiNP-TDO5, compared to the red curve with the Alexa488-labeled anti-PTK7 only. The black curve marks the fluorescence background with cells only, and the purple curve showed the binding of control antibody FITC-labeled isotype Mouse IgG2a.