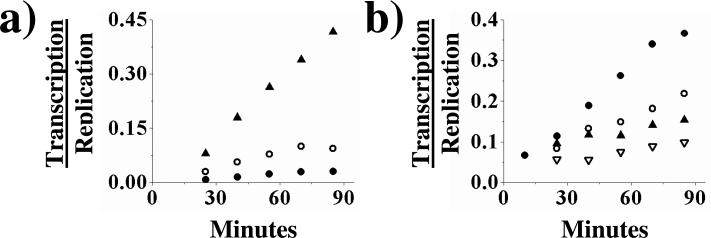
Figure 5.
Switching RdRp between transcription and replication. Panel a: A vRNA → cRNA replication assay was incubated for 10 minutes before being split into three aliquots and globin mRNA added to differing final concentrations: 0.9 ng/ul (•) 1.8 ng/ul (○) and 5.4 ng/ul (▲). The assays were allowed to incubate for another 75 minutes and products quantified. Panel b: A transcription/replication assay with an initial concentration of 650 nM vRNA was allowed to incubate for 10 minutes before being split into four aliquots and each with differing amounts of vRNA added to give final concentrations of: 650 nM (•), 1500 nM (○), 2500 nM (▲), and 5000 nM (▽). The assays were allowed to incubate for an additional 75 minutes and products quantified. The graphs depict the ratio of transcription to replication. Assays were performed as described under Experimental Procedures. The figures shown are single representatives of two separate experiments.

