
Figure 6.
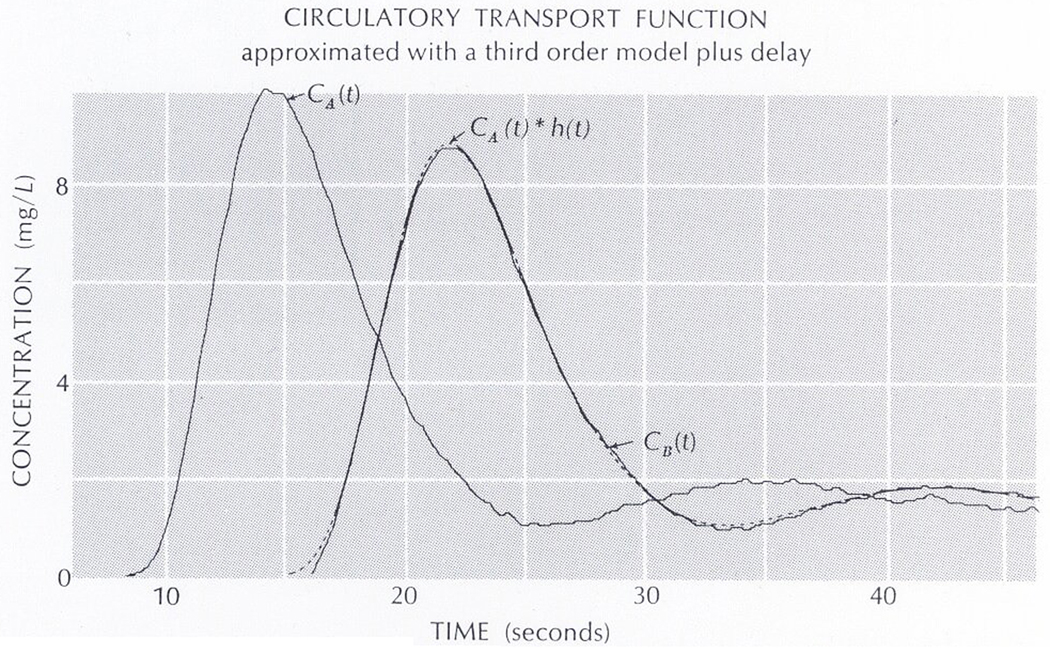
Upstream, CA(t), and downstream, CB(t), dilution curves are shown along with a theoretical downstream curve (dashed line) obtained using a simulated transport function, h(t)
Official websites use .gov
A
.gov website belongs to an official
government organization in the United States.
Secure .gov websites use HTTPS
A lock (
) or https:// means you've safely
connected to the .gov website. Share sensitive
information only on official, secure websites.
Upstream, CA(t), and downstream, CB(t), dilution curves are shown along with a theoretical downstream curve (dashed line) obtained using a simulated transport function, h(t)