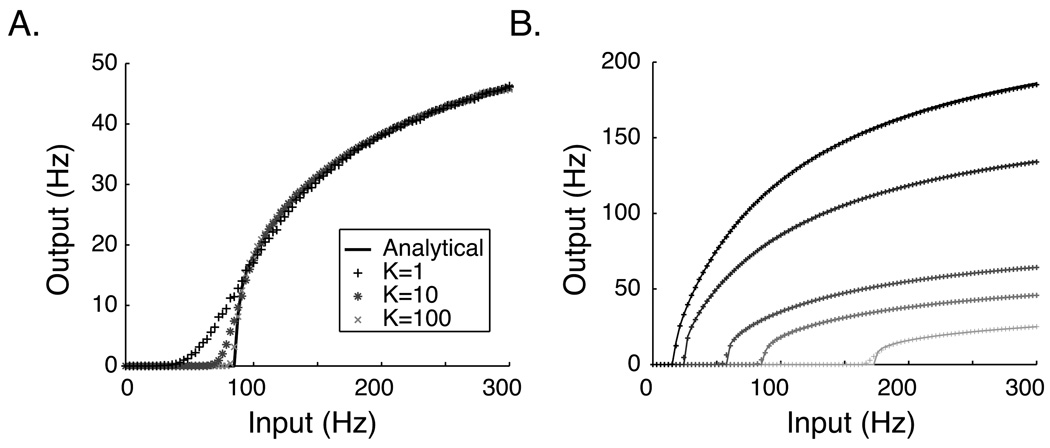
Figure 2.
Input-Output relationship of an IF neuron. A. The analytical ϕ curve (black line) calculated using MFT analysis (equation 12) with W = 3.4e-3 μS compared to numerically generated estimates of the output rate ν (symbols). K indicates the number of independent synapses driving activity in the numerically simulated neuron; individual synaptic weights are scaled by K so that the cumulative synaptic weight is constant for each of the three cases shown (K=1,10,100). As K increases, the numerical approximations approach the analytical curve. Note that in the model described in section 3, K=N=100 for the recurrent synapses. Deviations exist primarily in the low frequency input region where output is driven by fluctuations (see equations 13 and 14). B. The analytical solution (solid lines) compares well with numerical results (plus signs, K=100) for values of W ranging from 1.5e-3 μS (light gray) to 6.0e-3 (black). All parameters are as listed in section 3.

