Figure 4.
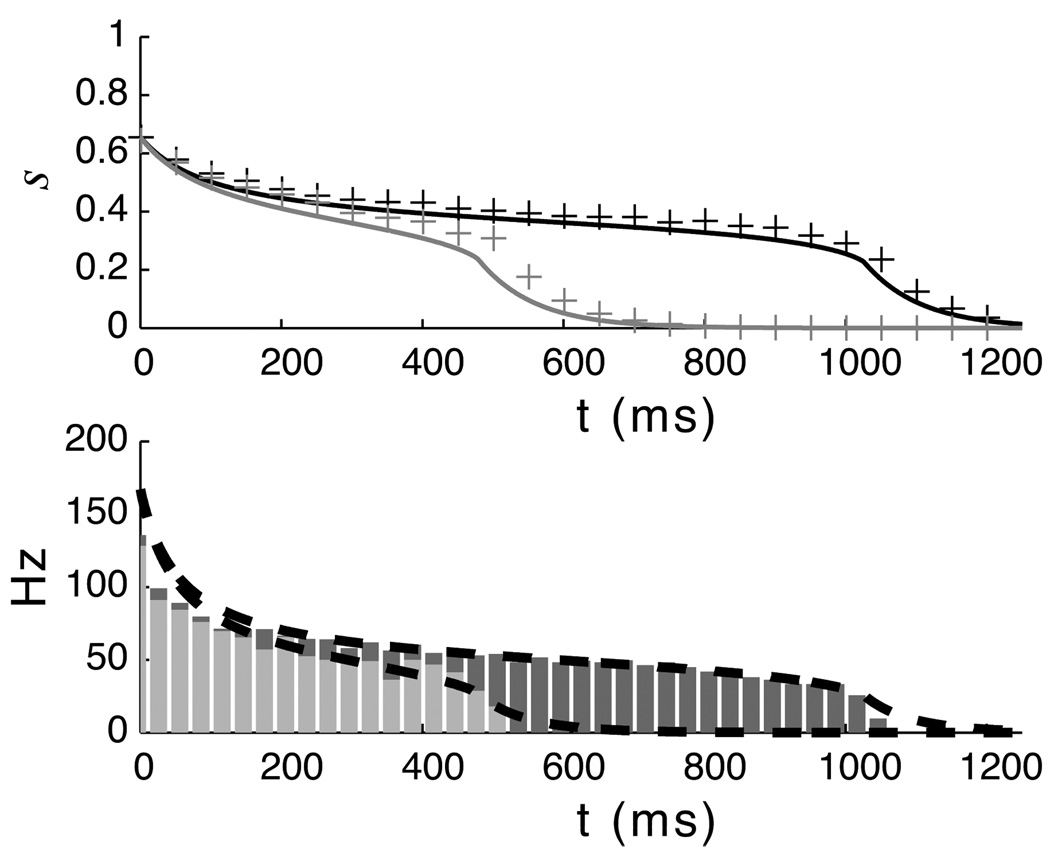
Pseudo steady-state model prediction compared to full I&F model. The plots above show trajectories generated by solving the pseudo steady-state equation compared to values extracted from the full spiking network model for two values of lateral recurrent weights. In the top plot, the solid lines are the trajectories predicted by integrating equation 15 and the stars indicate the average synaptic activation variable of 100 neurons participating in a temporal representation over a single run. In the bottom plot, the bars show the PSTH of the spiking neurons overlaid with the spike frequencies predicted from the mean-field theory (dashed black lines). The initial condition s(0)=0.625 was taken from the simulations of the complete network at the end of the stimulus period.

