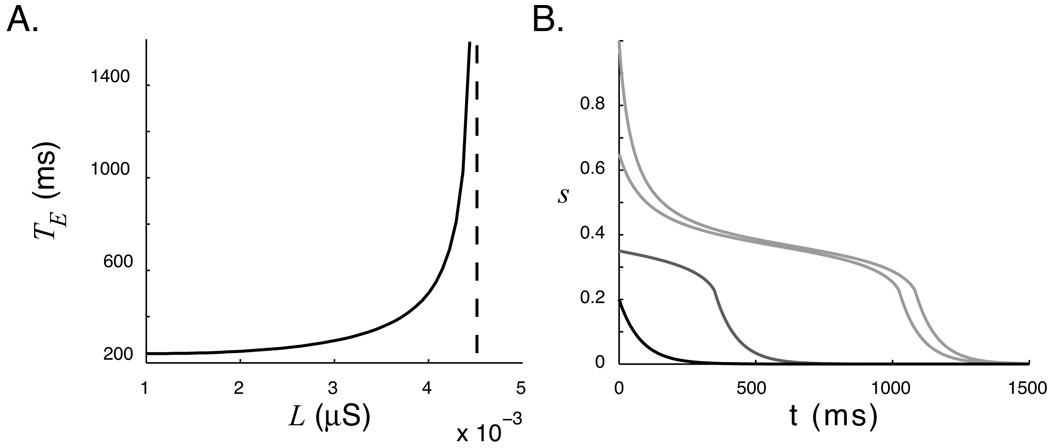
Figure 5.
A. The duration of encoded time estimated by integrating s from 1 to 0.05. With the parameters used in this paper, encoding times above approximately 1.5 s becomes difficult due to the sensitivity of the encoded representation to very small changes in L. B. Invariance of temporal representation to stimulus magnitude. This plot shows the pseudo-steady state system response of a single “trained” network with initial conditions representing different stimulus levels. If vigorous stimulation drives the network to a sufficiently high level, the temporal report is approximately the same (light gray lines). An intermediate stimulus show a degraded temporal report (gray), and the response to low-level stimulation (black) is identical to the report of an isolated neuron. Temporal reports above a threshold value of s (0) ≈ 0.45 are very similar.

