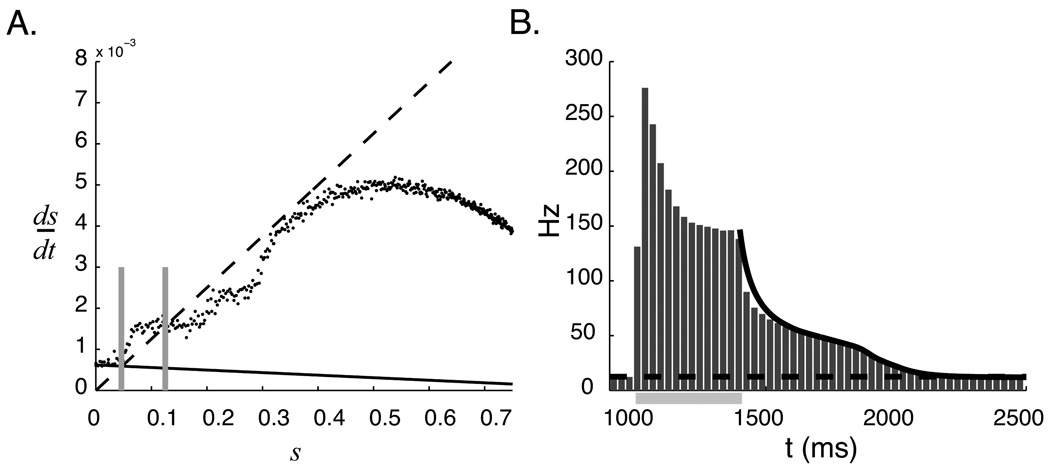
Figure 7.
Accounting for changes in spontaneous activity. A. The sink (dashed black line) and source curves for the cases that L = 0 (solid black line) and L = 3.4e-3 μS (black points, numerical estimates made over multiple simulation runs). Spontaneous activity occurs at, and is set by, the intersection of the source and sink curves (marked for both L values by two vertical gray lines). This plot shows that the spontaneous activity level increase from 4.2 Hz (s = 0.046) to 12.5 Hz (s = 0.125) as a function of recurrent excitation. B. Dynamics during the decay period (solid black line) calculated using this numerical curve and equation 15 match those seen in the full network model (gray bars show spike frequency in the network averaged over 50 runs over the period of stimulation, marked by the light gray bar, and temporal report). The dashed line marks the spontaneous activity level estimated from the full network and matches the value predicted from A.

