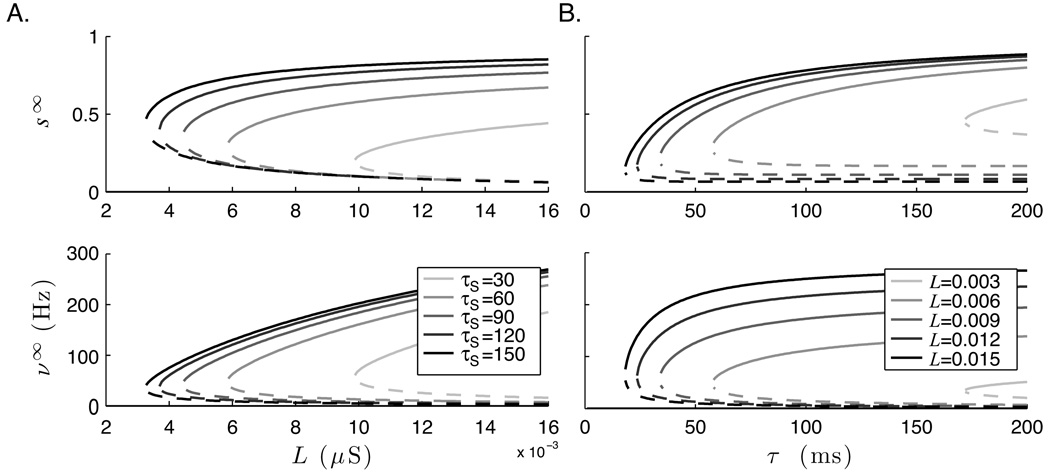
Figure 8.
Bifurcation diagrams of the fixed-point values from the pseudo steady-state model (equation 15) demonstrate bistability. Solid lines indicate stable fixed points, and dotted lines indicates unstable fixed points. The top plots shows the synaptic activation variable at steady states (s∞) and the bottom plots show the resultant firing rate (ν∞). A. Bistability as a function of lateral recurrent weights (L) over a range of τs values. B. Bistability as a function of τs for several fixed values of L. With zero spontaneous activity, all solutions have fixed point at s = 0.

