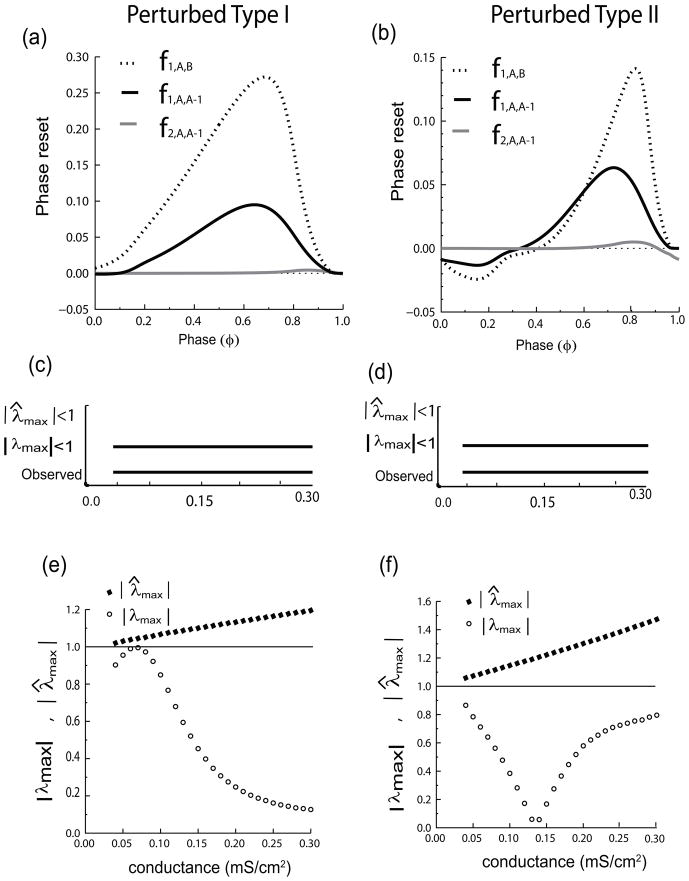
Fig. 7.
Perturbation Analysis of each of the Two Heterogenous Clusters example as in Fig. 6. In (a, c, and e) the perturbed cluster A is Type I and the unperturbed cluster B is Type II, whereas in (b, d, and f) the perturbed cluster A is Type II and the unperturbed cluster B is Type I. (a) and (b) Representative PRCs required for the stability analysis, which include the first order PRC of any group of neurons from cluster A in response to input from the entire cluster B (dotted line, gsyn = .16 mS/cm2), the first (solid black, gsyn = .08 mS/cm2) and second (grey) order PRC of neurons from cluster A in response to input from the other neurons in cluster A. Horizontal bars that are labeled ‘observed’ in (c) and (d) are the same and indicate the conductance values for which the heterogenous two cluster mode is stable based on observing the solutions obtained by integrating the full system of differential equations. Note |λmax| (or |λ̂max|) must be below one in a range of parameter values as indicated by the presence of a horizontal bar labeled |λmax| < 1 (or |λ̂max| < 1) in both (c) and (d) in order for a stable mode to be predicted. This is because the mode must be robust to both types of perturbations in order to persist. The absence of a bar labeled in (c) and (d) corresponding to |λ̂max| < 1 means that at no conductance value was |λ̂max| less than one in either (e) or (f), as illustrated by the filled black diamonds. This indicates that synchrony in each isolated cluster is unstable and incorrectly predicts that the two cluster mode will not be observed. However, |λmax| in both (e) and (f) is less than one for all values of conductance at which a two cluster mode was observed in (c) and (d), again showing that the analysis based on Fig. 2 is required for correct predictions in this case.

