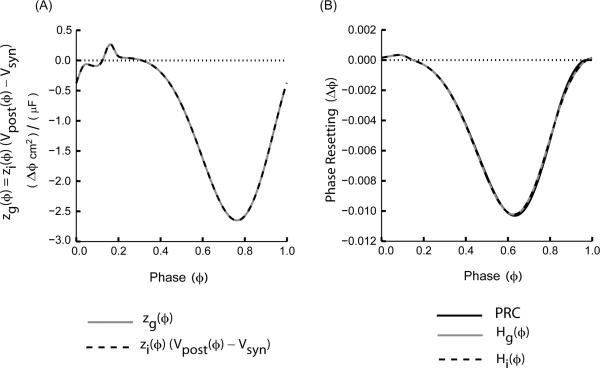
FIGURE 1.
Two ways of measuring the iPRC are equivalent. (A) zg (gray curve) is compared to zi scaled by (Vpost(ϕ)−Vsyn) (dashed curve) withVsyn = −75.0 mV corresponding to an inhibitory synapse for this example. (B) The directly measured PRC (solid black curve) is well-approximated by either Hg(ϕ) (gray curve) or Hi(ϕ) (black dotted curve). ML model neurons with Type I excitability and parameters as mentioned in the Appendix (A) with threshold = −14.0 mV, Vhalf = 0.0 mV, gsyn= 0.001 mS/cm2 and τsyn = 1.0 ms were used to generate the iPRCs and the PRCs.

