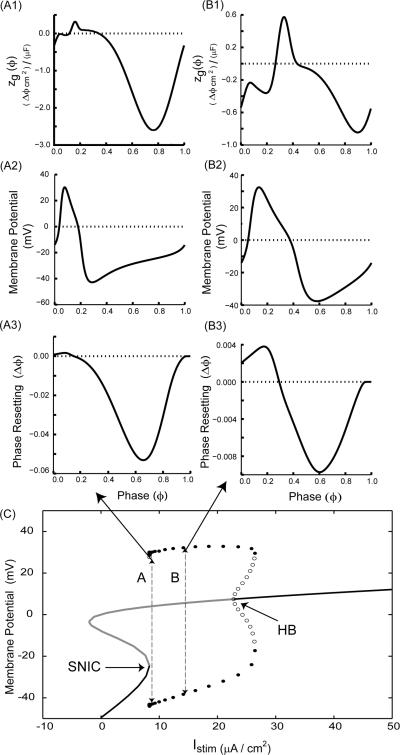
FIGURE 2.
For a constant synaptic input duration, higher frequencies resulting in an action potential that occupies a large fraction of cycle can lead to a Type II PRC with Type I excitability. (A) Low frequency example (Istim = 9.0 μA/cm2). (A1) zg(ϕ) (same as Fig. 1A) has a small initial anomalous region (above the dotted horizontal line). (A2) Membrane potential for one full cycle. (A3) Directly measured PRC. (B) High frequency example (Istim = 15.0 μA/cm2). (B1) zg(ϕ) has a larger anomalous region (above the dotted horizontal line). (B2) Membrane potential for one full cycle. (B3) Directly measured PRC. An increase in the ratio of the repolarization phase of the action potential to the cycle length (compare Figs. A2 and B2) leads to a larger region of advance in the PRC (compare Figs. A3 and B3). (C) Bifurcation diagram showing fixed points as well as the maxima and minima of a branch of limit cycles arising at the saddle node on invariant curcle (SNIC) bifurcation and terminating at the subcritical Hopf bifurcation (HB). Stable branches are indicated in black and unstable in gray. The closed circles indicate stable limit cycles and hollow circles indicate unstable limit cycles. The labels A and B stand for Istim values 9.0 μA/cm2 and 15.0 μA/cm2, respectively. The arrows indicate the corresponding PRCs. Note that PRCs at both the Istim values have advances as well as delays. A Type I ML model neuron with the same parameters as in Fig. 1 except gsyn= 0.005 mS/cm2 and as otherwise noted was used.

