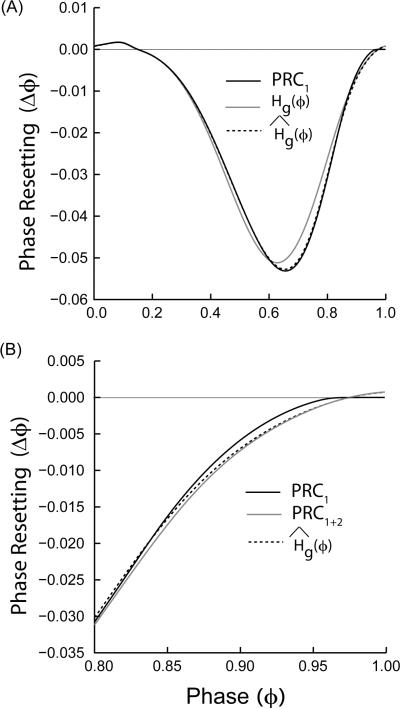
FIGURE 7.
Sources of error in the weak coupling estimation of the directly measured PRC. (A) Error introduced by not updating the phase continuously. The first order PRC1(solid black curve) obtained by the direct method matches Ĥg(ϕ) (black dashed curve) everywhere except towards the end of the phase cycle, whereas Hg(ϕ) (gray curve) produces a significant error. (B) Weak coupling methods do not distinguish between first and second order resetting. Comparing Ĥg(ϕ) (black dotted curve) to the sum of the first and second order resetting (PRC1+2, solid gray curve) obtained by the direct method instead of to PRC1 (solid black curve) eliminates any discrepancy at late phases. Type I ML model with inhibitory synapses and parameters as mentioned in the Appendix (A) with threshold = −14.0 mV, Vhalf = 0.0 mV, gsyn= 0.005 mS/cm2 and τsyn = 1.0 ms were used to generate all the PRCs.

