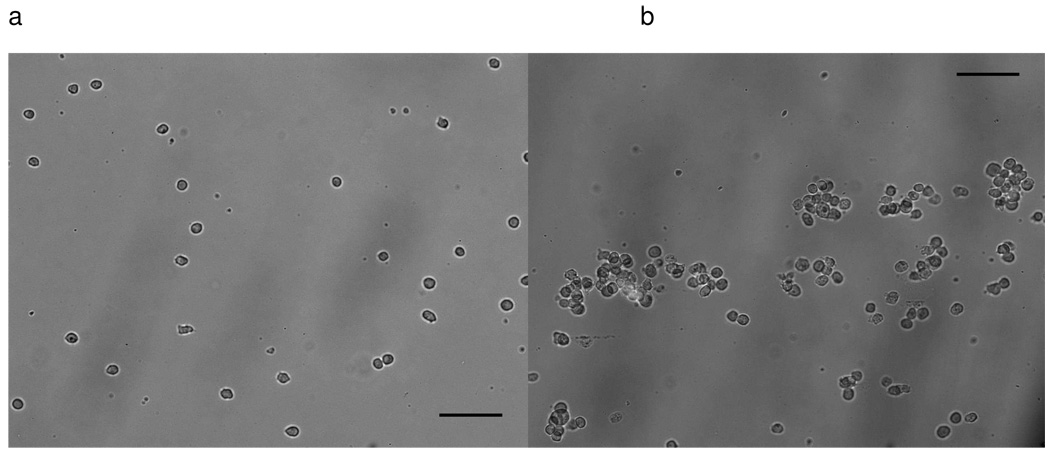
Fig.2.
Fluorescence images in the middle part of anti-CD71 separation chips, each showing >98% purity. a) Hut 78 cells captured in vertical inlets device. b) Hut 78 cells captured in parallel inlets device, bright cells in the picture are mouse endothelial cells. Continuous flow was employed for both devices. Cells were loaded at 0.5 ml/h and the flow rate was then changed to 0.05 ml/h to allow cells to be captured on the channel surface. The total injected sample volume was 10 µL. Cell sample concentration (5000±1000 cells/µL) and mixture ratio (HuT 78: Mouse endothelial ≈ 1:2) were the same to each experiment. Scale bar is 100 µm.

