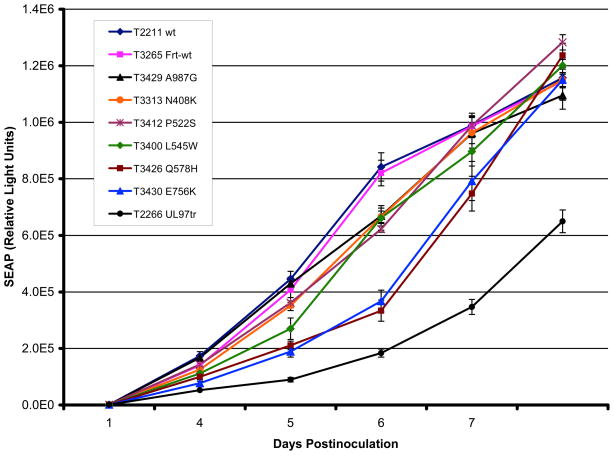
Figure 3. SEAP growth curves of baseline and mutant BACs.
Viral strains were inoculated at a multiplicity of infection of 0.02 as calibrated by supernatant SEAP activity at 24 hours. On each of days 4 to 8 postinoculation, culture supernatant was sampled for SEAP activity using a chemiluminescent substrate. Growth curves show the mean and standard deviation of values from 3 to 4 replicates of each strain set up in parallel. A severely growth inhibited UL97 kinase-defective mutant (T2266) was included as an additional control. The legend lists the strains in top to bottom order according to the position of their corresponding growth curves between days 5 and 6.

