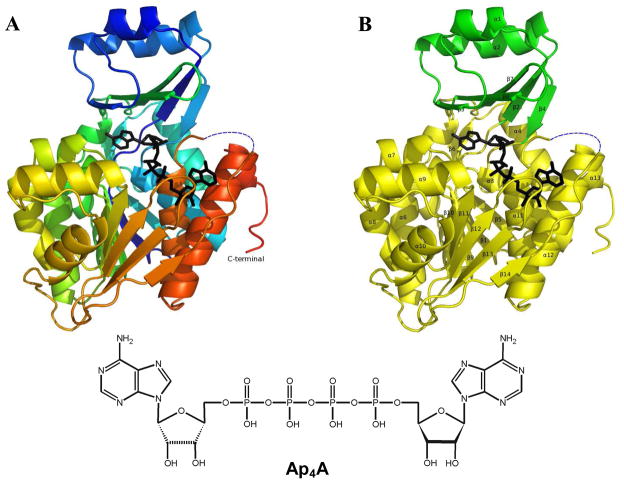
Figure 4.
The Ap4A bound AgAK structure depicted as a ribbon diagram. A: The Ap4A bound AgAK is ramped from blue to red (N terminus to C terminus) and Ap4A is depicted as sticks in black. The disordered region (residue 289 to 294) was indicated as a blue dash line. B: The small domain (residue 17 to 62 and residue 121 to 136) of AgAK and the large domain (the rest residues) of AgAK are drawn in green and yellow, respectively. The disordered region (residue 289 to 294) was indicated as a blue dash line.

