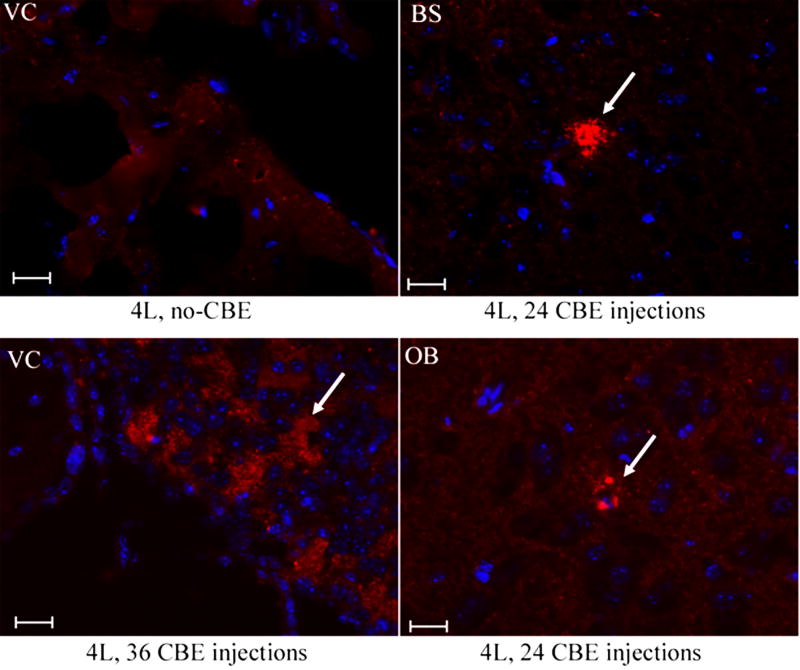
Figure 12. α-Synuclein in the brains of CBE-treated mice.
Brain sections from 8-wk 4L mice that had 24 or 36 daily injections with 100 mg CBE/kg/day were examined with anti-α-synuclein antibody. Aggregated α-synuclein signals (Alexa-610, red) were detected in ventricle (VC, lower left panel), brainstem (BS, upper right panel) and olfactory bulb (OB, lower right panel) in the injected mice (arrows), but not in untreated (no-CBE) 4L mice (upper left panel). The scale bars were 20 μm (40×).

