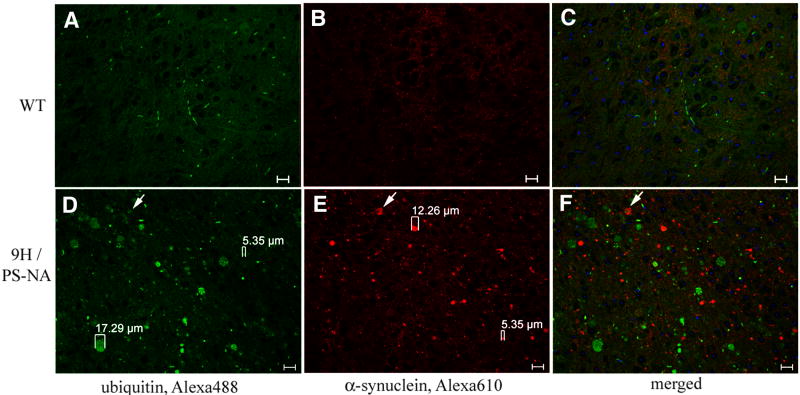
Figure 9. Expression of α-synuclein and ubiquitin in the brain.
Brain sections from 20-wk WT and 9H/PS-NA mice were examined with anti-ubiquitin (A and D, Alexa-488, green) and anti-α-synuclein (B and E, Alexa-610, red) antibodies as indicated. The panels show the midbrain region. Various sizes (5 – 17 μm) of ubiquitin and α-synuclein signals were seen only in 9H/PS-NA (D and E), and not in WT (A and B) brain. The ubiquitin signals were only partially co-localized with α-synuclein signals (arrow) in 9H/PS-NA (F) and not in WT (C). The scale bars are 20 μm.

