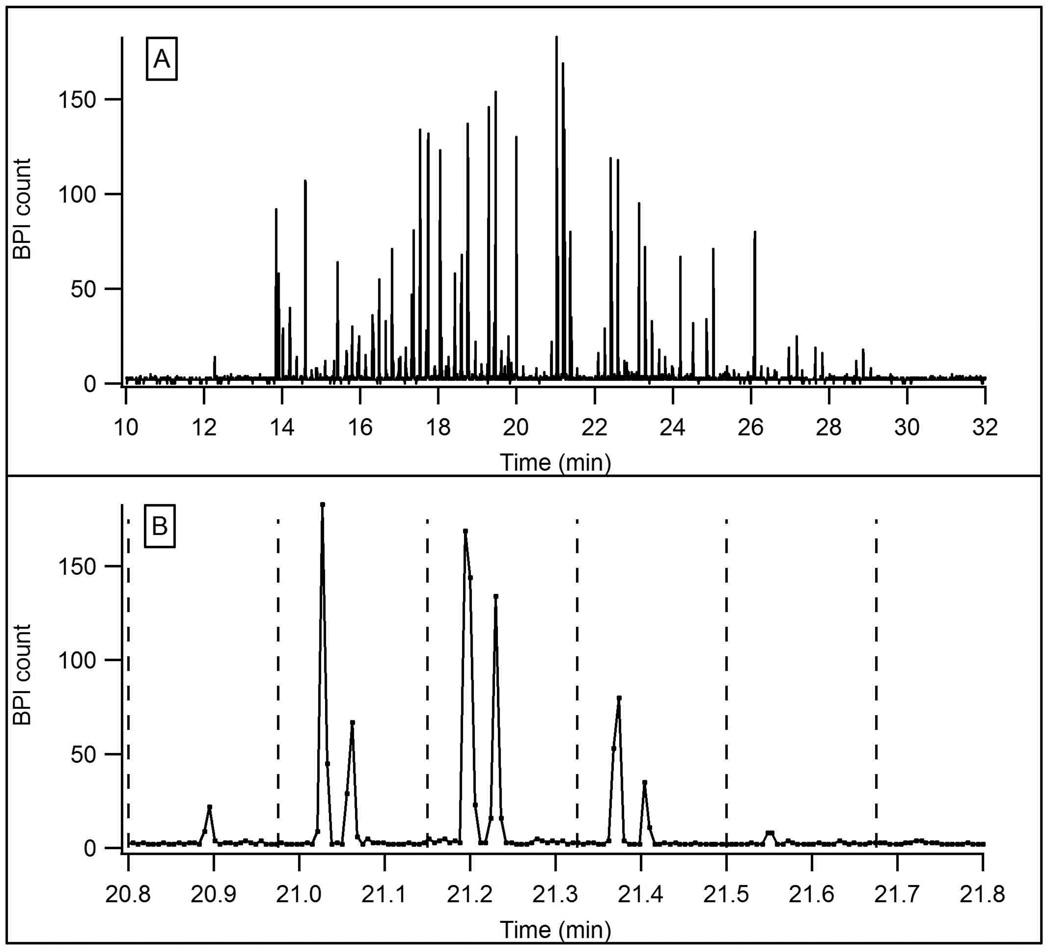
Figure 6.
A) BPI chromato-electropherogram for the LC-CE-MS analysis of the same tryptic digest of BSA and enolase shown in Figure 4. LC conditions were the same as in Figure 4. Injections were made into the CE dimension every 10 s. CE BGE: 1% formic acid, 25% acetonitrile, field strength: 1.1 kV/cm. B) An expanded view of a 1 min interval in the separation above. Dashed lines indicate CE separation windows.

