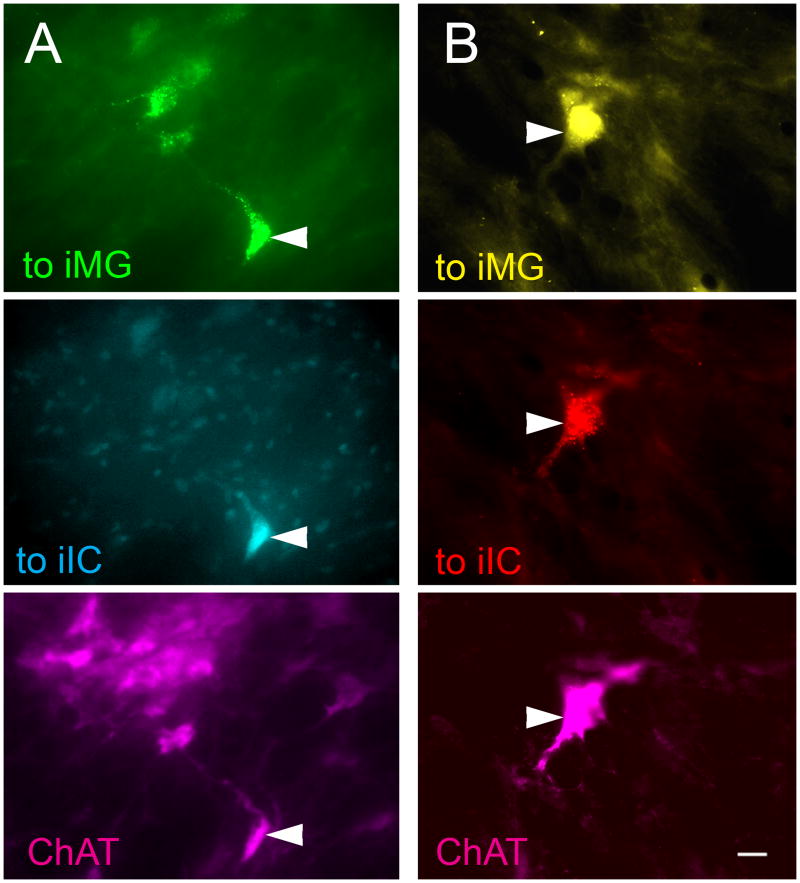
Figure 5.
Photomicrographs of immunopositive PMT cells that project to both the ipsilateral IC and the ipsilateral MG. For each column, the top panel represents labeling from the injection in the ipsilateral MG, the middle panel represents labeling from the injection in the ipsilateral IC, and the bottom panel represents immunolabeling for ChAT. In each column all three panels show the same field of view using different filters to visualize the different fluorescent labels. A) Green beads were injected into the left MG and Fast Blue was injected into the left IC. Arrowhead - cell in the left PPT labeled for GB (top panel), FB (middle panel), and ChAT-immunoreactivity (bottom panel). GP 587. B) FG was injected into the left MG and RB was injected into the left IC. Arrowhead - cell in the left PPT labeled for FG (top panel), RB (middle panel), and ChAT-immunoreactivity (bottom panel). Scale bars = 10 μm. iIC, ipsilateral IC; iMG, ipsilateral MG.

