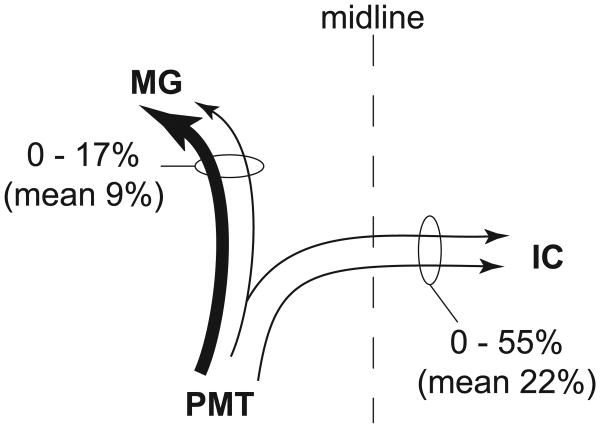
Figure 8.
Schematic summary of cholinergic collateral projections from PMT cells to the contralateral IC and ipsilateral MG. Six cases were used for quantitative analysis of this projection pattern. The numbers express the percentages of cells with collateral projections compared with the cells that project to only one of the two nuclei. Line thickness reflects the relative size of the projection (measured as the number of cells found in each projection).

