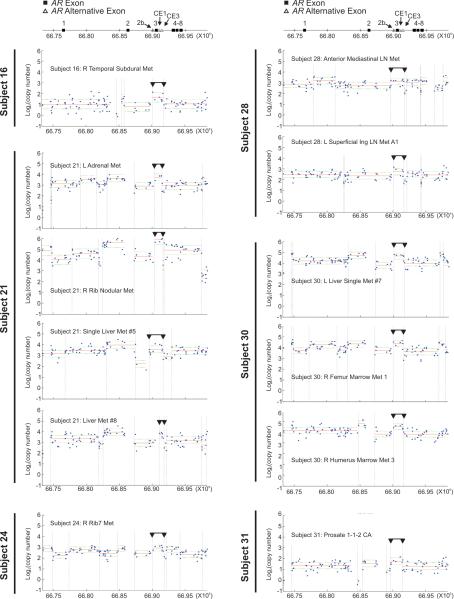
Figure 3.
AR intragenic rearrangements in CRPCa detected by Affymetrix Genome Wide SNP 6.0 Array analysis of metastatic tissues. Top, Exon organization of the AR locus on Xq11-12 and chromosome position (human genome build 19, hg19) is indicated at the top of each panel. All panels shown are individual tissue samples from CRPCa metastases. Blue dots represent probe-level copy number, horizontal red lines represent mean segment copy number, horizontal green dashed lines represent standard deviation, and dashed vertical lines represent segment boundaries defined by the segmentation algorithm. Black horizontal lines with downward-facing arrowheads denote a region of focal copy number alteration similar to 22Rv1 cells.

