
Figure 2. Adenovirus-mediated shRNA silencing of JPH2 in HL-1 cells.
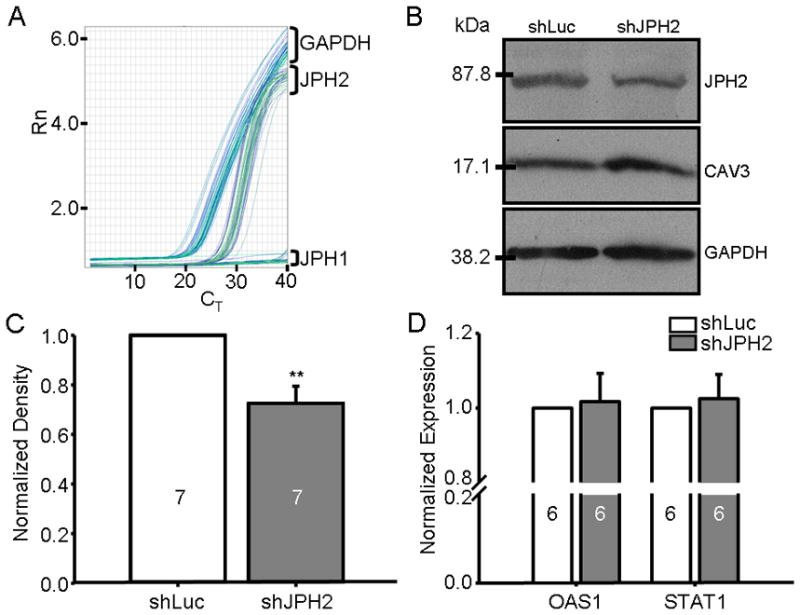
A. Representative qRT-PCR plot of normalized fluorescence (Rn) intensity versus PCR cycle number (CT) for three transcript-specific probe sets including JPH1, JPH2, and GAPDH targeted to un-treated HL-1 cDNA. B. Western blot of JPH2, CAV3, and GAPDH levels from HL-1 cells infected with AdX-shLuc and controls. C. Bar graph showing relative difference in band density of AdX-shJPH2 infected cells from independent Western blots relative to AdX-shLuc normalized to GAPDH (N = 7). **, P < 0.01. D. Bar graph demonstrating mean RNA expression levels of OAS1 and STAT1 by qRT-PCR of AdX-shJPH2 infected cells (dark gray bars) relative to controls (white bars, N = 6 runs).