
Figure 4. JPH2 knock-down reduces intracellular Ca2+ transients.
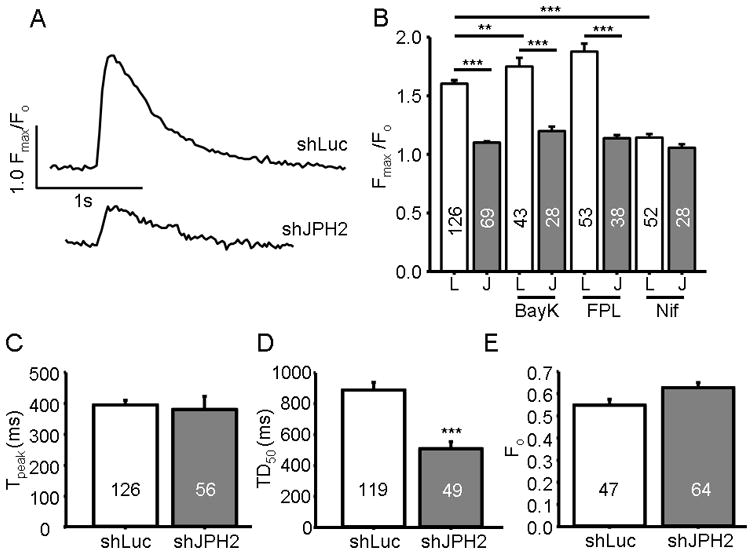
A. Representative Ca2+ transient tracing of an HL-1 cell transiently transfected with pCMS-shJPH2 or shLuc measuring relative fluorescent intensity (Fmax/Fo) versus time. B. Bar graph of the mean Ca2+ transient amplitude in HL-1 cells transiently transfected with pCMS-shJPH2 or control. Cells were treated with LTCC activators BayK or FPL or LTCC blocker nifedipine (Nif). Numbers in bar graphs indicate number of cells analyzed. **, P < 0.01; ***, P < 0.0001 C, and D. Bar graph of time to transient peak, and time to decay to half maximum intensity, respectively, in HL-1 cells transiently transfected with pCMS-shJPH2 or control. ***, P < 0.0001 E. Bar graph of the mean resting Ca2+ levels in cells transiently transfected with pCMS-shJPH2 or control. Numbers in bar graphs indicate number of cells analyzed.