
Figure 5. Knock-down of JPH2 increased store Ca2+ yet reduced RyR2-dependent caffeine-mediated store Ca2+ release.
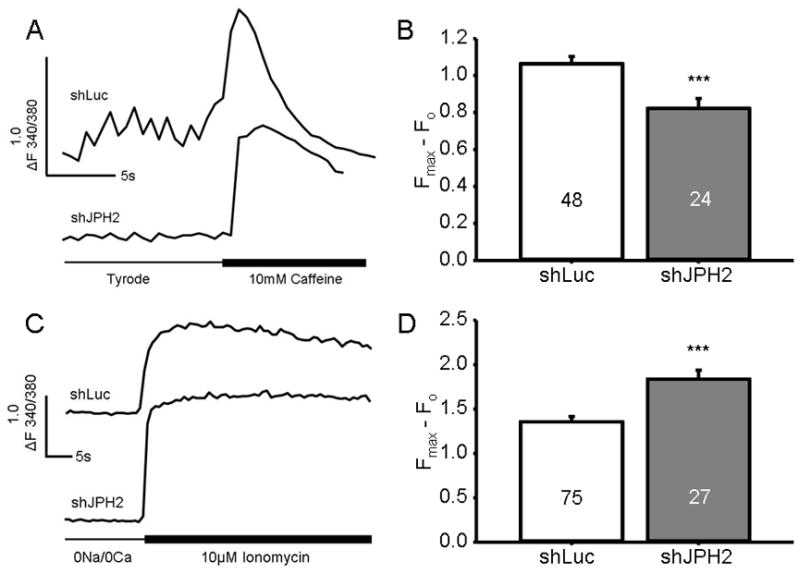
A. Representative Ca2+ tracing of HL-1 cells following caffeine application. B. Bar graph showing mean amplitude of Ca2+ efflux from the SR in pCMS-shRNA-treated cells exposed to caffeine. Numbers in bar graph indicate number of cells analyzed. ***, P < 0.0001. C. Representative Ca2+ tracing of HL-1 cells following ionomycin treatment. D. Bar graph showing mean amplitude of Ca2+ efflux from all stores in pCMS-shRNA-treated cells exposed to ionomycin. Numbers in bar graph indicate number of cells analyzed. ***, P < 0.0001.