
Figure 6. Knock-down of JPH2 blunts generation of spontaneous Ca2+ oscillations with modulation of extracellular Ca2+ levels.
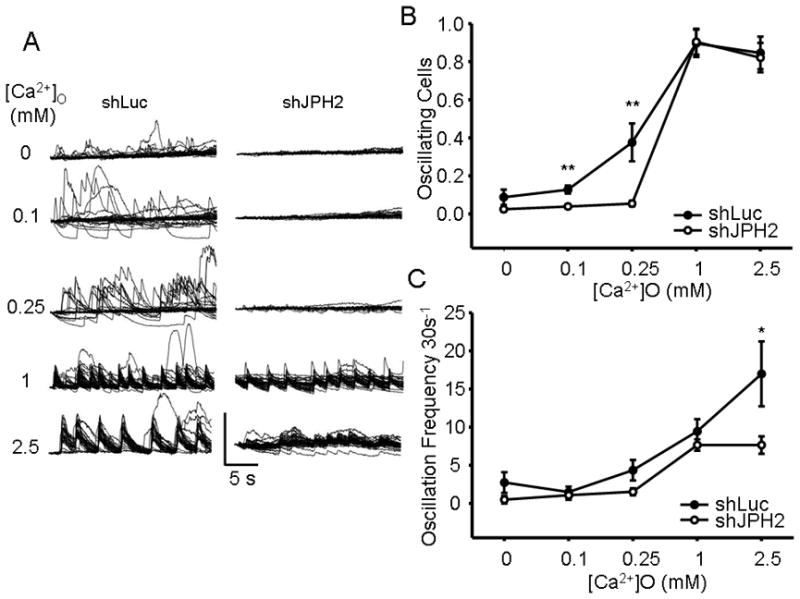
A. Representative individual Ca2+ tracings from a field of AdX-shJPH2 infected HL-1 cells with increasing levels of [Ca2+]o. B. A graph of proportion of spontaneously oscillating cells per field versus increasing [Ca2+]o for both AdX-shJPH2 infected cells and control. **, P < 0.01. C. A graph of the number of field-wide spontaneous oscillations per 30 seconds versus increasing [Ca2+]o for both AdX-shJPH2 infected cells and control. *, P < 0.05.