
Figure 1.
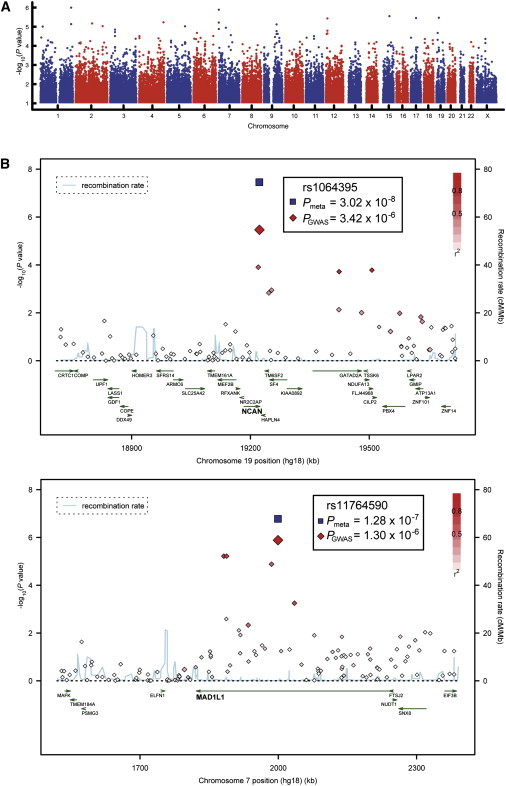
Association Results for the GWAS and the Two Best-Supported Genes from the Follow-Up Study
(A) Manhattan plot.
(B) Regional association plots (RAPs) displaying NCAN and MAD1L1. The most associated marker from the GWAS (enlarged red diamond) is centered in a genomic window of 1 Mb (hg18, RefSeq genes); its p value from the combined analysis (meta) is shown (enlarged blue diamond). The LD strength (r2) between the sentinel SNP from the GWAS and its flanking markers is demonstrated by the red (high) to white (low) color bar. The recombination rate (cM/Mb; second y axis) is plotted in blue, according to HapMap-CEU. RAPs were generated with SNAP.42