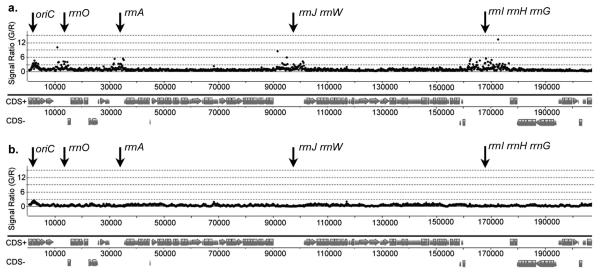
Fig. 2.
ChIP-chip analysis of DnaB. Wild type cells (strain 168) were grown in LB (a) or defined minimal medium (b) and sampled during exponential growth. Data are plotted as in Fig. 1, except the chromosomal positions are shown from 0 kb (oriC) to just past rrnI, H, G at ~200 kb. Similar results were obtained at each identical rrn with both DnaD and DnaB, indicating the reproducibility of the data. Results were also confirmed by qPCR with independent samples from different strains (Fig. 3). Data from other rrn regions are presented in Supplementary Information (Supplementary Fig. 5). The rrn sequences represent a consensus and were thus presented as identical23. For clarity and simplicity, we unambiguously label each individual locus according to its chromosomal location.

