Figure 1.
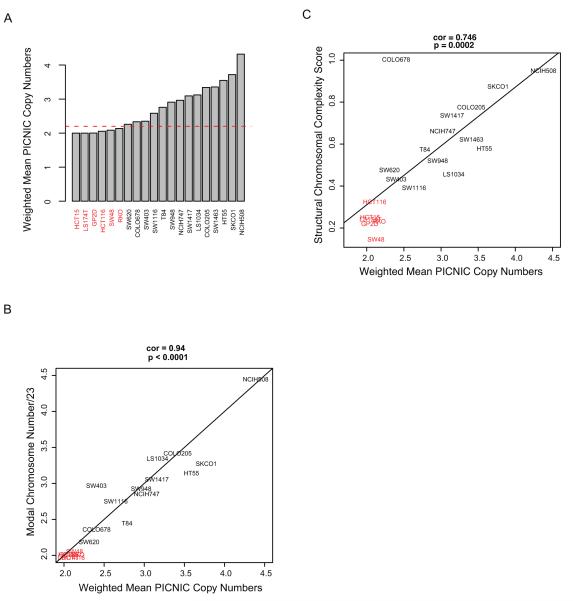
A) Barplot of the ploidy status of 20 CRC cell lines determined using mean copy number PICNIC analysis of SNP Array data. Red line indicates ploidy value threshold of 2.2. CIN+ cell lines in black text and CIN− cell lines in red text throughout.
B) Correlation of modal chromosomal numbers and weighted mean copy numbers of the cell lines as determined by PICNIC. Pearson’s CC=0.94, p<0.0001.
C) Correlation of Structural Chromosomal Complexity Score with ploidy as determined by weighted mean copy number PICNIC analysis of SNP Array data. Pearson’s CC=0.746, p=0.0002.

