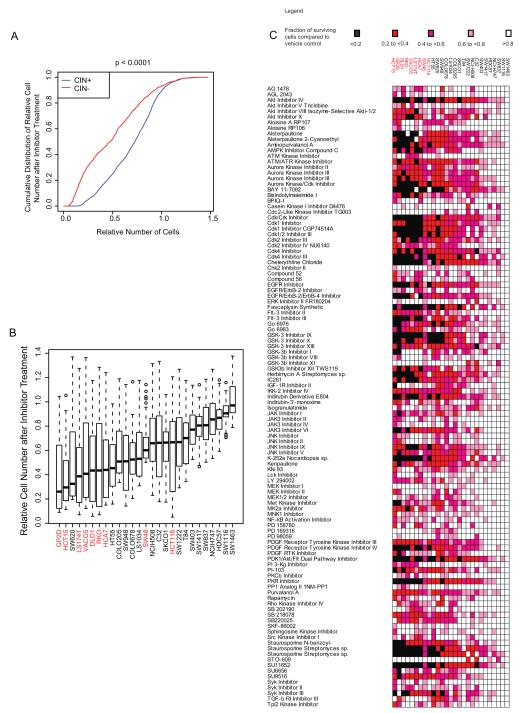
Figure 2.
18 CIN+ and 9 CIN− CRC cell lines were treated with 160 kinase inhibitors at 10μM for 72 hours.
A) A higher fraction of cells survive inhibitor treatment in CIN+ cell lines compared to CIN− cell lines. (p<0.0001).
B) Boxplot of median cell number following inhibitor treatment across all inhibitors for all cell lines. The length of the whiskers was limited by maximal=1.5 times the IQR in this boxplot and throughout.
C) Heatmap showing the relative numbers of surviving cells following inhibitor treatment across the cell lines (Inhibitors that have minimal impact on cell growth defined as a surviving cell fraction of >0.8 in >75% of the cell lines tested have been excluded).

