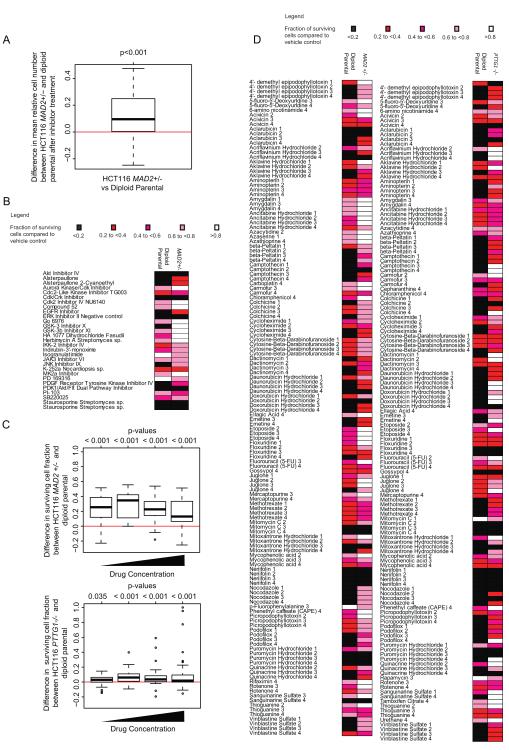
Figure 3.
A) Boxplot showing that following treatment with kinase inhibitors, there appeared to be a higher surviving fraction of cells in the HCT116 MAD2+/− cell line compared to its parental diploid cell line (p<0.001) following treatment with each equivalent inhibitor.
B) Heatmap showing the relative numbers of surviving cells following the inhibitor treatments compared to vehicle control across the HCT116 MAD2+/− and parental diploid cell lines (Inhibitors that show a surviving cell fraction of >0.8 in both cell lines have been excluded).
C) Biolog M11-M14 drug microplates were used at 4 increasing concentrations per drug (0.1μM to 25μM) to treat HCT116 MAD2+/− and PTTG1 −/− and their parental diploid cell lines for 72 hours. The boxplot shows difference in relative surviving cell number across all drugs at each of the four concentrations, comparing MAD2+/− and PTTG1 −/− cells to their specific isogenic parental cells. Significant p-values suggest higher resistance in MAD2+/− or PTTG1−/− cells compared to their parental diploid cells
D) Heatmap of surviving fraction of cells compared to negative control in HCT116 MAD2+/−, PTTG1 −/− and their parental diploid cell lines treated with Biolog drug microplates. Drugs resulting in a surviving cellular fraction of >0.8 compared to negative control in both isogenic cell lines were excluded.

