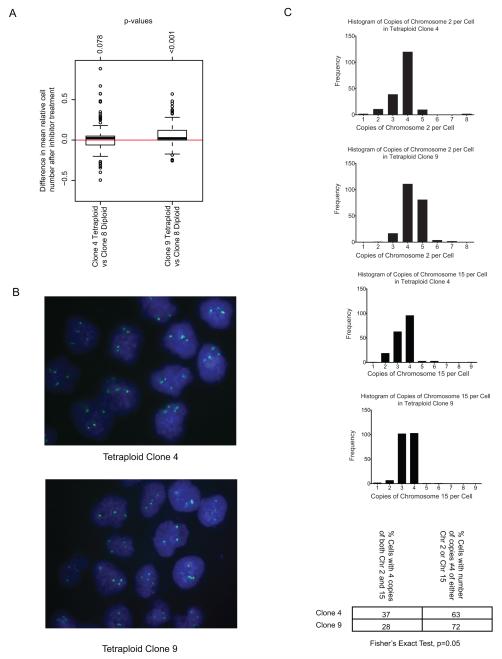
Figure 4.
A) Boxplot of relative surviving cell numbers comparing HCT116 Tetraploid Clone 4 (TC4) and Diploid Clone 8 (DC8) cell lines, and Tetraploid Clone 9 (TC9) with DC8 cell lines. The TC9 cell line was significantly more resistant compared to DC8 (p<0.001). The difference in drug sensitivity between TC4 and DC8 was not significant (p=0.078).
B) Representative FISH images for TC4 and TC9. Probes against Chromosome 15 in green.
C) Histogram showing distribution of number of markers per cell corresponding to Chromosome 2 (top two) and 15 (bottom two) in TC4 and TC9. TC9 had a statistically significant higher proportion of cells that deviated from having 4 copies of both Chromosome 2 and 15 (p=0.05) compared to TC4.

