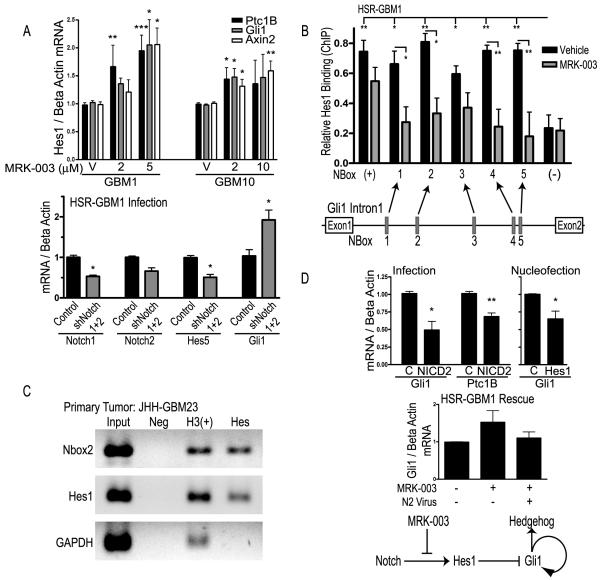
Figure 2.
Notch regulates Gli1 expression. A, mRNA levels of Hedgehog and Wnt pathway targets after treatment with MRK-003, upper panel. Expression of Notch1, Notch2, Hes5, and Gli1 after infection with shRNA, lower panel. B, ChIP of Hes1 measured via QPCR relative to IgG in HSR-GBM1. Positive and negative controls are p27 and p63, respectively. Schematic of N-Box locations in the Gli1first intron is shown below. C, ChIP of a primary GBM specimen measured via non-quantitative PCR relative to IgG. Negative and positive controls are Rabbit IgG and acetyl histone H3, respectively. D, mRNA levels of Gli1 and Ptc1B after infection with control (C) or activated Notch2 virus (NICD2), and mRNA levels of Gli1 after nucleofection with Hes1 or control plasmid, upper panel. Rescue experiment showing induction of Gli1 with MRK-003 treatment is inhibited by addition of activated Notch2 virus, lower panel. Schematic of interaction between Notch and Hedgehog signaling. * P<0.05, ** P< 0.005, *** P<0.0005, using Student’s t-test.

