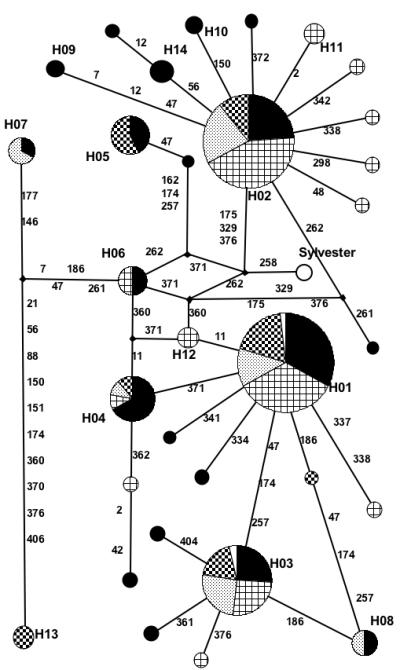
FIG. 3.

Minimal Spanning Network of mtDNA CR Haplotypes for All Cat Populations. Specific populations are represented by colors: California (solid black), Hawaii (open squares), New York (stipled), and Texas (checkered squares). Unfilled wedges in H01 and H03 represent control sample mitotypes. Bold designators (H##) indicate haplotypes. Theoretical intermediary haplotypes are identified by diamond nodes. Samples without identifiers are unique. The composite “Sylvester” reference sequence is noted. Numbers on the branches indicate the positions and amount of mutations needed to derive connecting mitotypes.
